#
Grafana
Grafana is an open source visualization and analytics software. It allows to query, visualize, alert on, and explore metrics, logs, and traces no matter where they are stored.
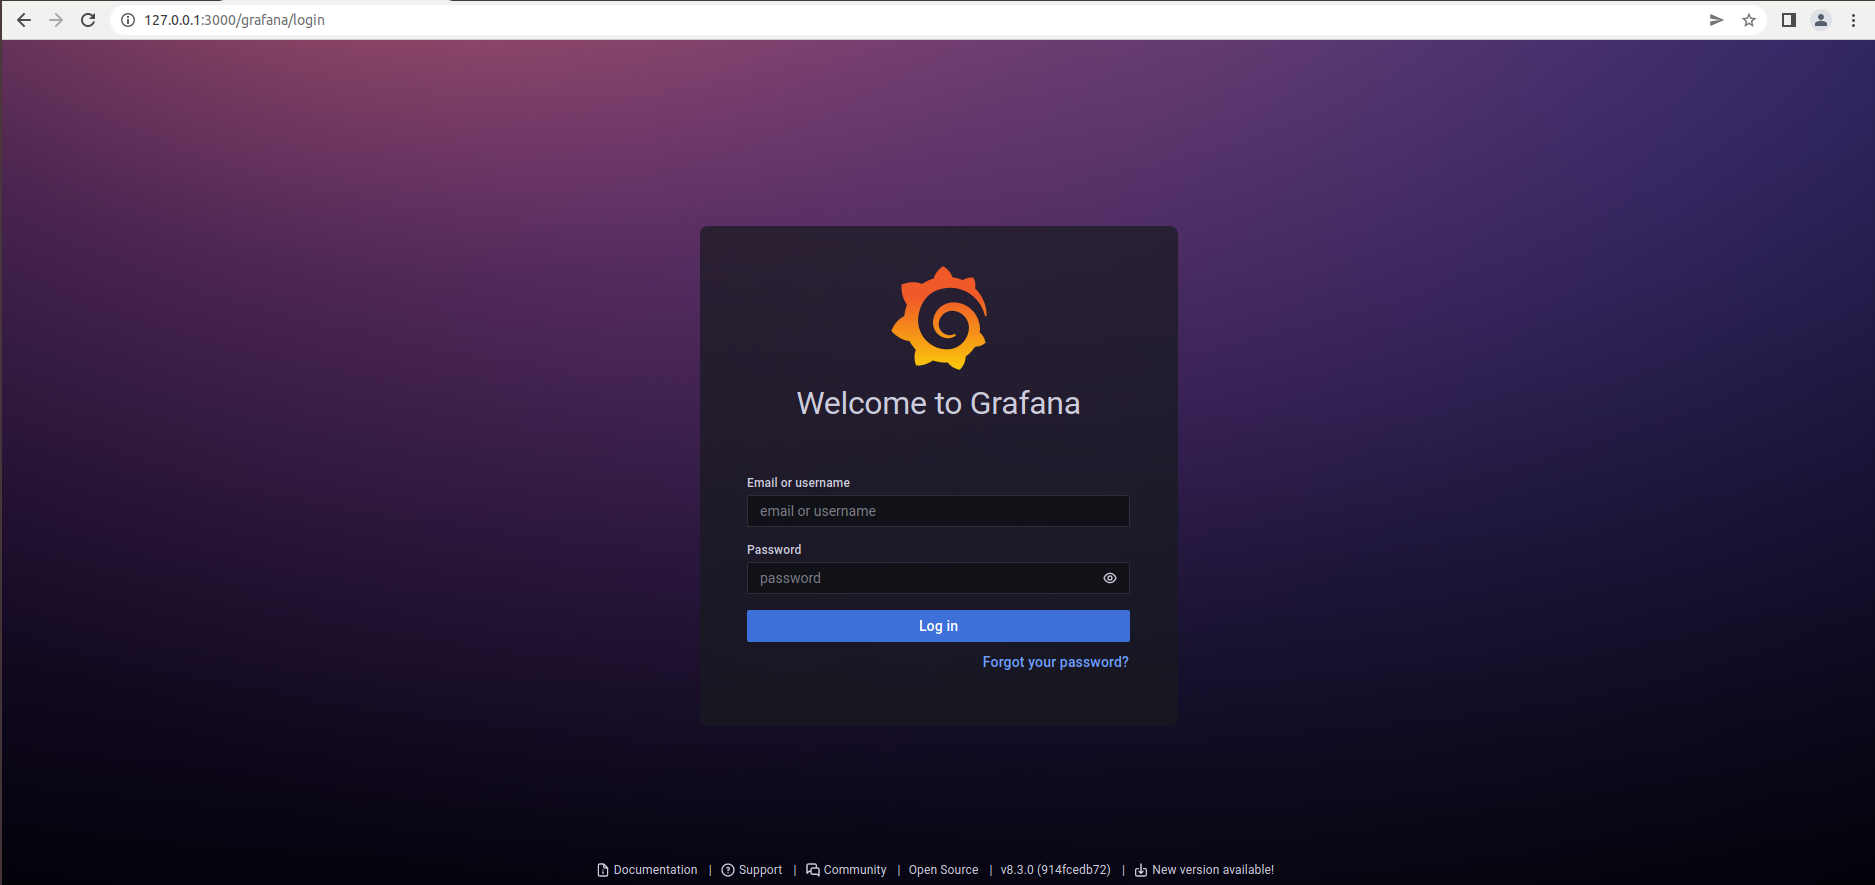
By default, Grafana can be accessed at localhost:3000 or 127.0.0.1:3000
Default credentials are:
Username: frinx
Password: frinx123!
#
Monitoring
Grafana in FRINX Machine monitors multitude of metrics. At this time, these are:
- Device monitoring
- FRINX Machine logs
- Node monitoring
- Swarm monitoring
- SSL monitoring
- UniConfig-controller monitoring
- Workflows monitoring
#
Device Monitoring
This dashboard displays data on a specific installed device/node.
#
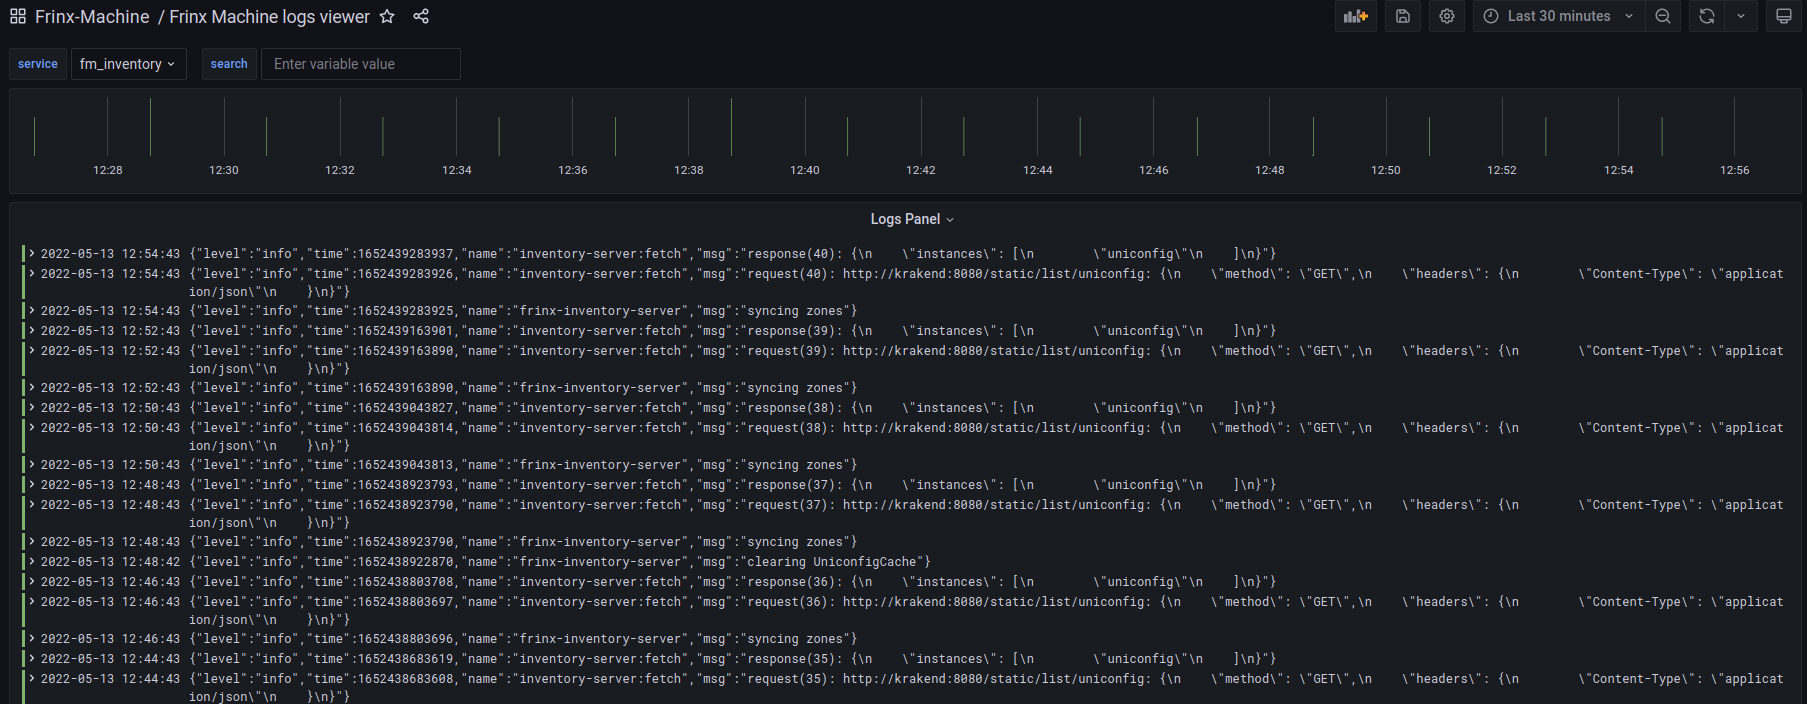
FRINX Machine Logs
This dashboard monitors all services running in FRINX Machine. You can filter by individual services, and also look for a specific value.
#
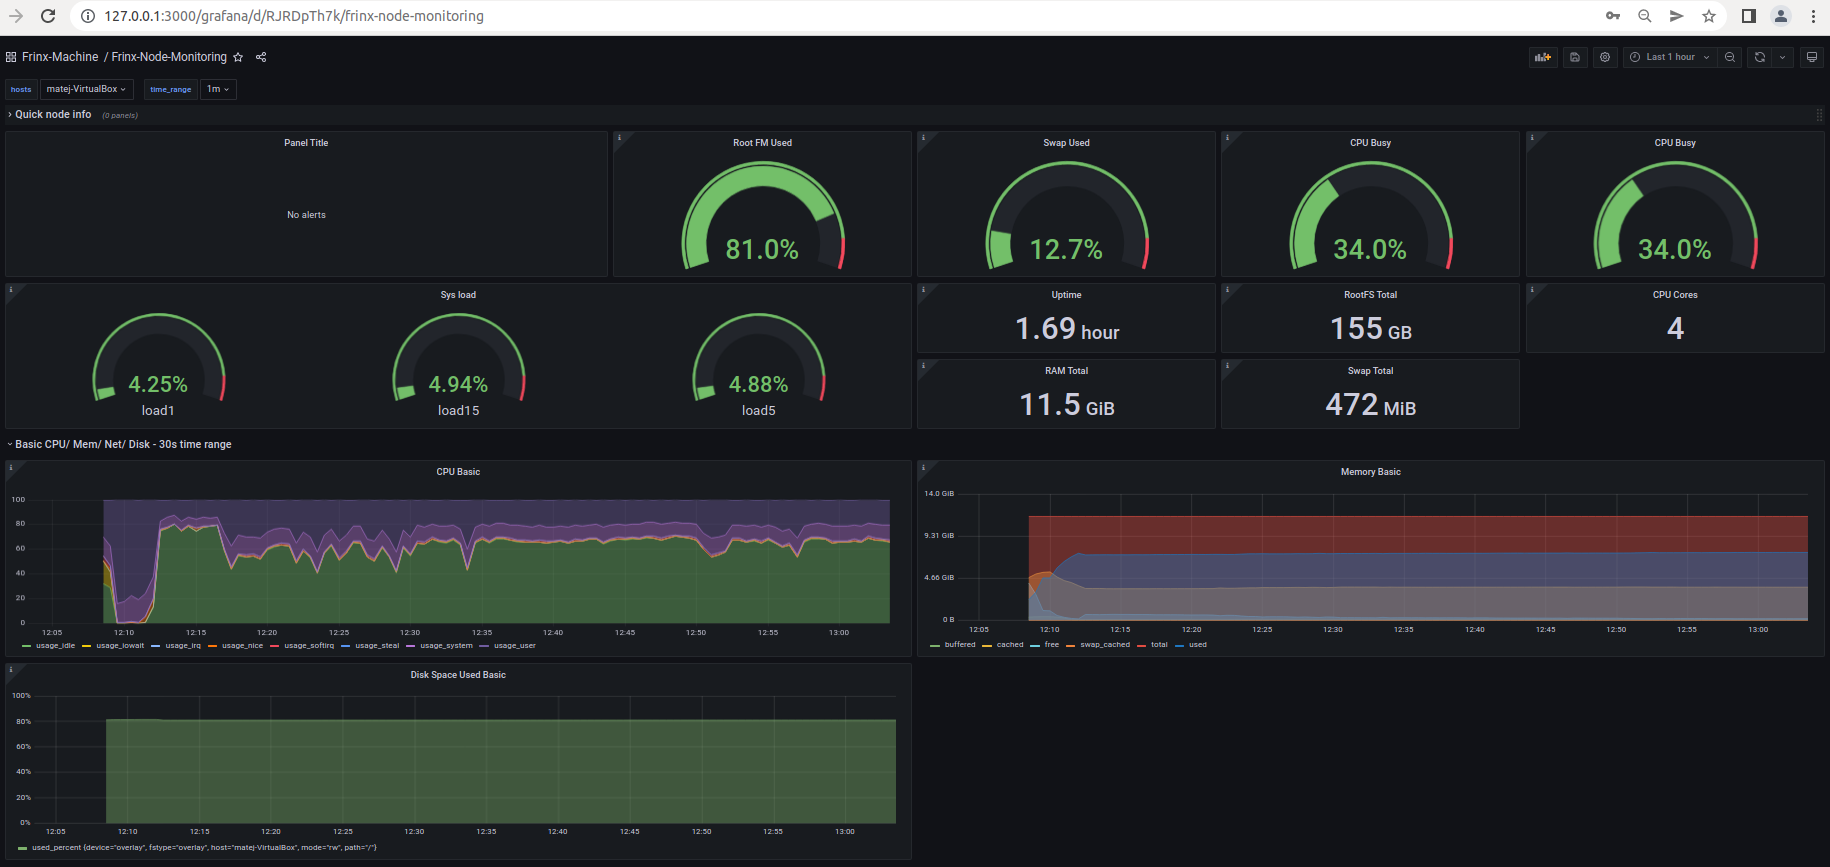
FRINX Machine Node Monitoring
This dashboard monitors the state of VM/System where FRINX Machine is running. It reports info like CPU utilisation, Memory utilisation, Disk usage, Up-time etc.
#
FRINX Machine Swarm Monitoring
This dashboard monitors metrics specifically tied to FM within the VM/System.
Metrics like Up-time, Available/Utilised memory, Number of running/stopped containers, CPU usage per container, Memory usage per container, Incoming/Outcoming network traffic, etc.

#
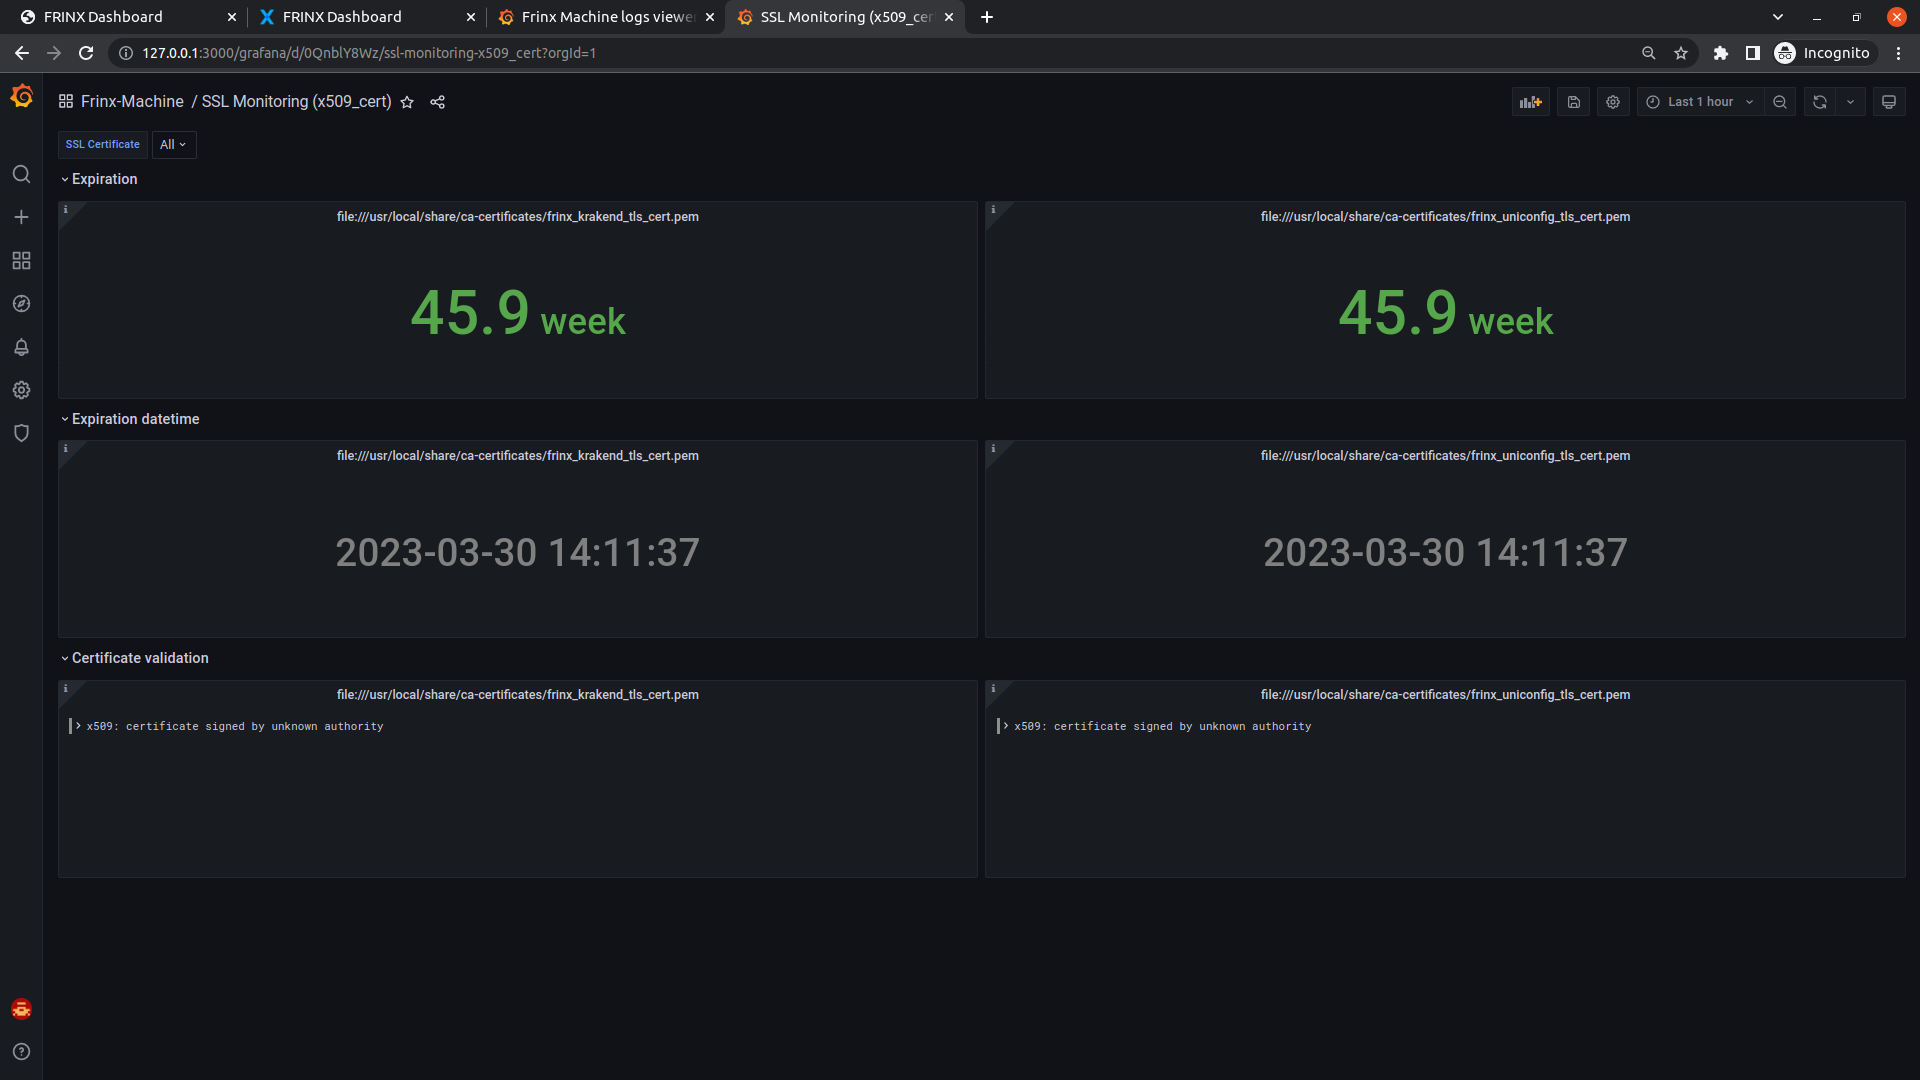
SSL Monitoring
This dashboard displays data about your SSL certificates. It displays dates until your certificates are valid.
#
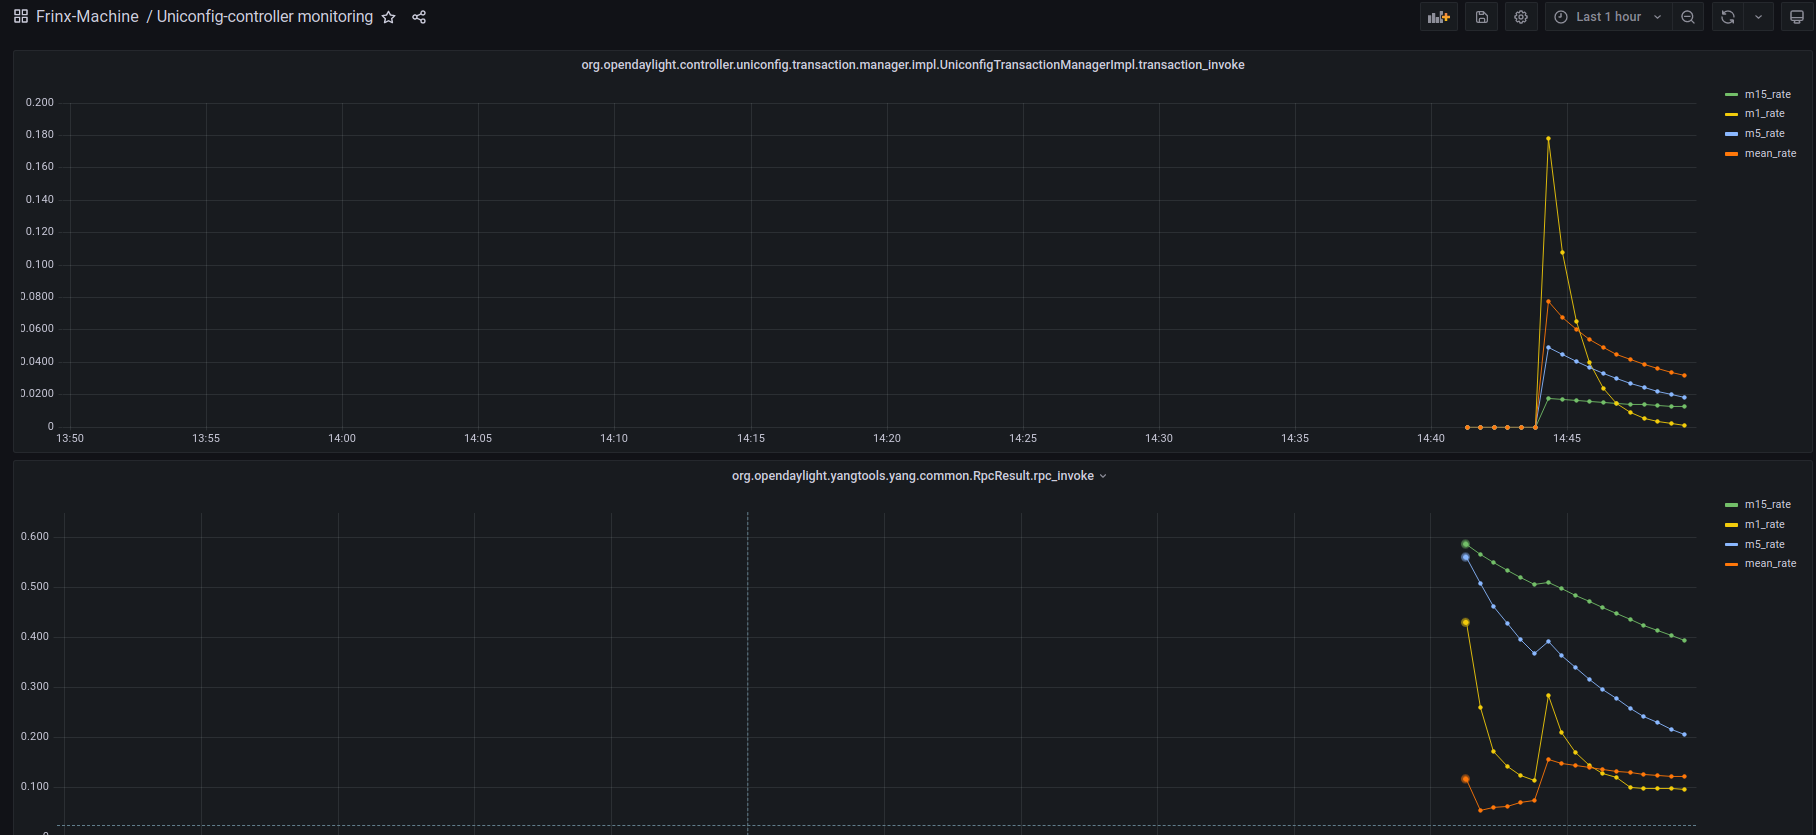
UniConfig Controller Monitoring
This dashboard keeps track of various UniConfig transactions. It displays number of transactions at a given time.
#
Workflows Monitoring
Collecting data on workflows is being worked on.
